1.4 KiB
1.4 KiB
Assignment 08-09
Requirements
- Create a graphical user interface using the Qt framework for the problem you have been working on (A04-05, A06, A07).
Week 11
- Implement the interface design, without using the Qt Designer. Use layouts to design your interface.
- The list or table displaying the repository entities in administrator mode should be populated using your input file.
Week 13
- All functionalities must be available through the GUI. You may use Qt Designer, if you want to change the initial design of your GUI.
- The functionality of the application must be the same (including the one-by-one iteration of objects for the user mode).
Bonus possibility (0.2p, deadline week 13)
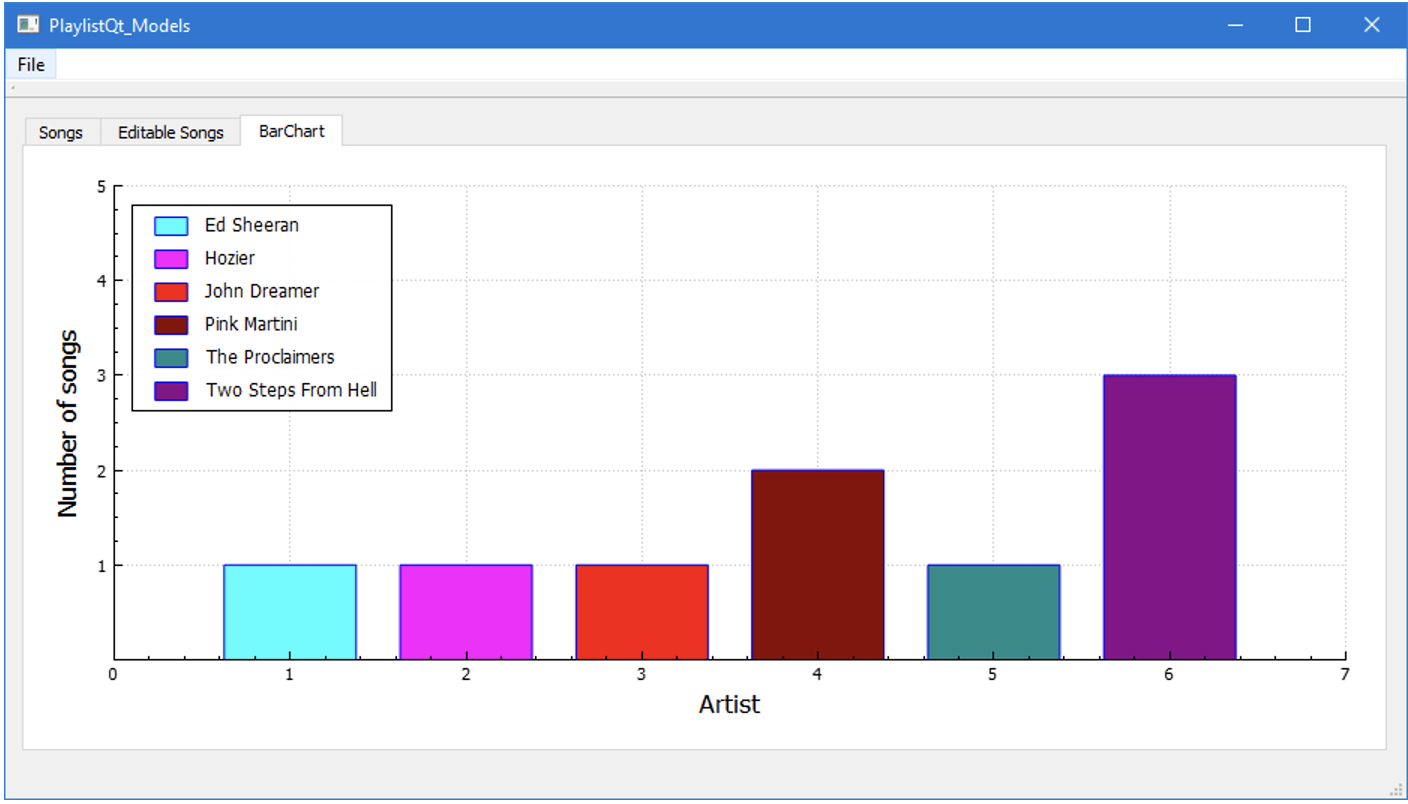
Create a graphical representation of the data in your application. You have an example below: a bar chart representing the number of songs for each artist. Your representations can be a bar chart, a pie chart or another type of chart. You can even use circles or rectangles or any other geometric shapes to represent the data.
Hint: You can use QPainter (https://doc.qt.io/qt-6/qpainter.html), QGraphicsScene (https://doc.qt.io/qt-6/qgraphicsscene.html) or a special widget designed for plotting and data visualisation – QCustomPlot (http://www.qcustomplot.com/).